School history, shared
Athletic Archive Storage Capacity Forecast: Plan for Photos, Video, and Records
A school that runs out of storage does not lose old files immediately—it stops collecting new ones. Photos from this season go unarchived. Championship video sits on a coach’s phone. Season statistics never get deposited. The result is a gap in the historical record that becomes permanent once the equipment changes hands or the staff member moves on.
An athletic archive storage capacity forecast gives your team a concrete number: how many gigabytes your program will need this year, next year, and five years from now—before a limit is hit, not after. This guide walks through the forecasting formula, the key assumptions by asset type, a five-year planning table you can adapt for your school’s size and content mix, and the annual review habit that keeps the forecast accurate as formats, equipment, and collection practices evolve.
Why Athletic Archives Grow Unevenly—and Why That Makes Planning Harder
Athletic archives do not grow at a steady, predictable rate. They grow in bursts driven by equipment upgrades, new collection policies, backlog digitization projects, and video adoption decisions.
Common growth triggers that catch programs off guard:
- A new camera system producing RAW files that are 3–5× larger than the JPEG workflow they replaced
- A booster association hiring a videographer for the first time, adding hours of 4K footage per season
- A digitization project that ingests 20 years of scanned yearbook pages and game programs in a single year
- A streaming platform migration that deposits full-game archives back to school-controlled storage
- A new hall-of-fame display requiring high-resolution versions of assets that were previously stored only as web-sized copies
Planning that assumes last year’s storage consumption will simply repeat next year consistently underestimates real growth. A forecast built around asset categories—with explicit, documented assumptions about file counts and sizes—catches these shifts before they create storage emergencies.

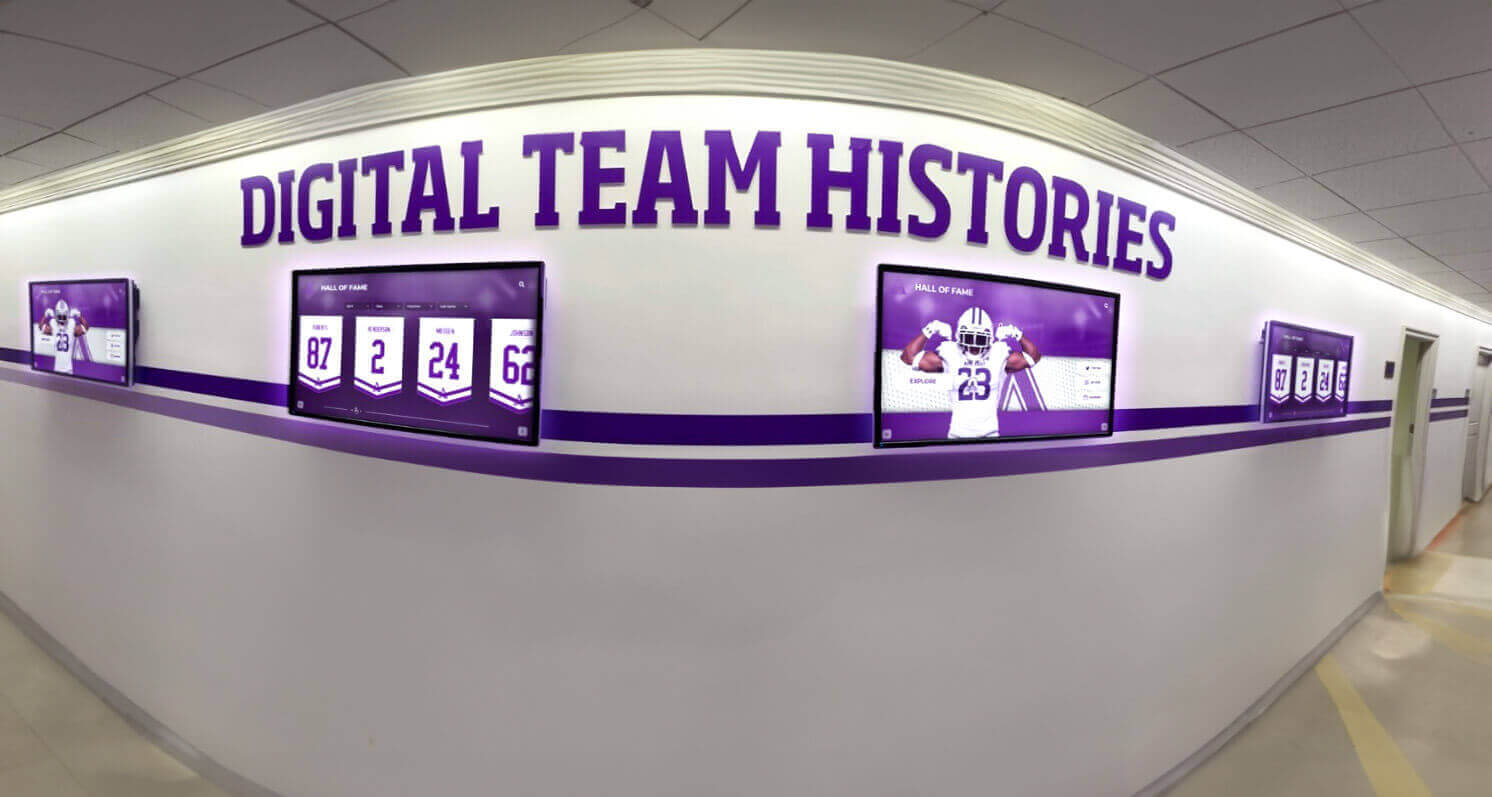
Recognition displays that draw on athletic archives are only as current as the archive behind them—capacity planning keeps new content flowing without hitting unexpected limits
The Athletic Archive Storage Capacity Forecast Formula
A working forecast uses five input categories. Adjust the categories to match your program’s actual asset mix.
Annual New Storage (GB) = (P × SpP) + (V × SpV) + (G × SpG) + (S × SpS) + (D × SpD)
| Variable | What It Represents |
|---|---|
| P | Total photos collected per year (all sports, all events) |
| SpP | Average storage per photo, in GB |
| V | Short video clips per year (highlights, interviews, reels under 10 minutes) |
| SpV | Average storage per short clip, in GB |
| G | Full game or event recordings per year |
| SpG | Average storage per full recording, in GB |
| S | Scanned pages added per year (yearbook pages, programs, clippings, certificates) |
| SpS | Average storage per scan, in GB |
| D | Documents added per year (rosters, statistics exports, PDFs, design files) |
| SpD | Average storage per document, in GB |
Then multiply the total by 3 to account for the 3-2-1 backup rule: one working copy, one local backup, one off-site or cloud backup. This gives the total provisioned storage your program needs each year—not just the primary archive footprint.
Quick example: A mid-size high school collects 2,000 photos (6 MB average), 60 short clips (500 MB average), 15 full game recordings (6 GB average), 150 scanned pages (15 MB average), and 80 documents (3 MB average) per year.
Annual raw storage = (2,000 × 0.006) + (60 × 0.5) + (15 × 6) + (150 × 0.015) + (80 × 0.003) = 12 + 30 + 90 + 2.25 + 0.24 = 134.5 GB raw
With 3-copy redundancy: ~404 GB total provisioned storage per year
Asset-Type Size Assumptions Table
The table below provides conservative and realistic file-size ranges for the most common athletic archive asset types. Use the “Realistic Planning Size” column when building your first forecast; adjust once you measure actual files from your existing collection.
| Asset Type | Conservative Size | Realistic Planning Size | Notes |
|---|---|---|---|
| Game action photo (JPEG, high-res) | 4 MB | 6–8 MB | 24 MP+ cameras are common; RAW roughly doubles this |
| Team portrait (JPEG, studio) | 3 MB | 5–6 MB | Portrait sessions often cover 10–30 athletes per team |
| Short video clip (MP4, 1080p, under 10 min) | 300 MB | 500–800 MB | Highlight edits, interviews, award ceremonies |
| Full game recording (MP4, 1080p, ~2 hours) | 4 GB | 6–8 GB | H.264 encoding; 4K roughly triples this |
| Full game recording (MP4, 4K, ~2 hours) | 12 GB | 14–18 GB | Budget for a 4K migration if new cameras are planned |
| Scanned yearbook page (TIFF, archival) | 10 MB | 15–20 MB | 400 DPI minimum for archival quality |
| Scanned yearbook page (JPEG, access copy) | 1.5 MB | 2–4 MB | Paired with a TIFF master; 300 DPI |
| Scanned game program page (TIFF) | 8 MB | 12–16 MB | Programs typically run 8–24 pages |
| Statistics export (CSV or XLSX) | 50 KB | 0.1–0.5 MB | Very small; rarely a meaningful driver |
| Season statistics PDF report | 500 KB | 1–3 MB | Includes formatting and embedded images |
| Design file (print-ready PDF) | 5 MB | 8–15 MB | Game programs, posters, sponsor banners |
| Design source file (InDesign, PSD) | 50 MB | 80–200 MB | Large when linked high-res images are embedded |
Key adjustment triggers: If your program upgrades from 1080p to 4K video, revise the SpG assumption immediately—storage per game recording roughly triples. If a digitization project launches for historical yearbooks, add a one-time backlog estimate as a separate line item rather than folding it into the recurring annual forecast.
5-Year Storage Growth Projection: Planning Tables
Use this structure to project cumulative storage needs across a five-year window. The two scenarios below illustrate a smaller high school program and a larger multi-sport program. Both assume 15% annual growth in raw storage, driven by higher-resolution equipment and gradually expanding collection scope.
Smaller High School Program (baseline: ~135 GB/year raw)
| Year | Annual Raw (GB) | Annual w/ 3× Backup (GB) | Cumulative Total (GB) |
|---|---|---|---|
| Year 1 | 135 | 405 | 405 |
| Year 2 | 155 | 465 | 870 |
| Year 3 | 179 | 537 | 1,407 |
| Year 4 | 206 | 618 | 2,025 |
| Year 5 | 236 | 708 | 2,733 |
Larger Multi-Sport Program (baseline: ~600 GB/year raw)
| Year | Annual Raw (GB) | Annual w/ 3× Backup (GB) | Cumulative Total (GB) |
|---|---|---|---|
| Year 1 | 600 | 1,800 | 1,800 |
| Year 2 | 690 | 2,070 | 3,870 |
| Year 3 | 793 | 2,379 | 6,249 |
| Year 4 | 912 | 2,736 | 8,985 |
| Year 5 | 1,049 | 3,147 | 12,132 |
Reading the table: “Cumulative Total” is the total provisioned storage your program needs at the end of each year—covering all copies of all assets collected since tracking began. This is the number to use when evaluating storage contracts, budgeting for drives, or sizing a cloud plan.
Step-by-Step: How to Build Your Own Forecast
Step 1 — Count Last Year’s Actual Asset Intake
Pull counts from wherever files were collected: shared drives, photo management platforms, video libraries, digitization logs. You need approximate numbers for each category in the formula. If exact counts are unavailable, estimate from event records: number of games, number of photo sessions, number of scanning sessions completed.
For programs just beginning to formalize their archive, the guide on file naming conventions for athletic archive assets includes an inventory method that produces usable file counts as a by-product of organizing existing materials.
Step 2 — Measure a Sample of Actual File Sizes
Select 20–30 files from each category and record their sizes. Calculate the average. This measured average is more accurate than any reference table because it reflects your specific equipment, export settings, and shooting practices.
File-size differences between programs are substantial. A school shooting with a 24-megapixel camera in JPEG Fine mode will produce files roughly half the size of a school using the same camera body in RAW+JPEG mode. Only measuring your own files produces a forecast that is specific to your program.
Step 3 — Apply the Formula
Multiply your counts by your measured averages for each category. Sum the categories. Multiply by 3 for backup copies. The result is your annual provisioned storage requirement for the current year.
Step 4 — Apply an Annual Growth Rate
For programs with established workflows and no planned equipment changes, 10–12% annual growth in raw storage is a reasonable starting assumption. Programs expecting camera upgrades, new sports coverage, or a backlog digitization project should use 20–30% for the affected years and return to 10–12% after the transition period ends.
The guide on digitizing team photos for school archives covers how digitization projects generate significant one-time storage demand that is best modeled separately from the recurring annual baseline rather than folded into it.
Step 5 — Build the Five-Year Table
Populate a table with the structure shown above. The forecast does not need to live in a spreadsheet application—a simple grid in a word processor serves equally well as a planning document. The point is to have a written number available for budget conversations, vendor negotiations, and IT planning cycles.
Step 6 — Add a Contingency Buffer
Add 20–25% to each year’s total as a contingency buffer. This covers unanticipated donations of historical materials, unexpected video production, or format migration projects that temporarily double storage requirements while old and new copies coexist. A buffer also prevents a forecast from becoming an exact ceiling that staff feel pressure to stay under by skipping collection.
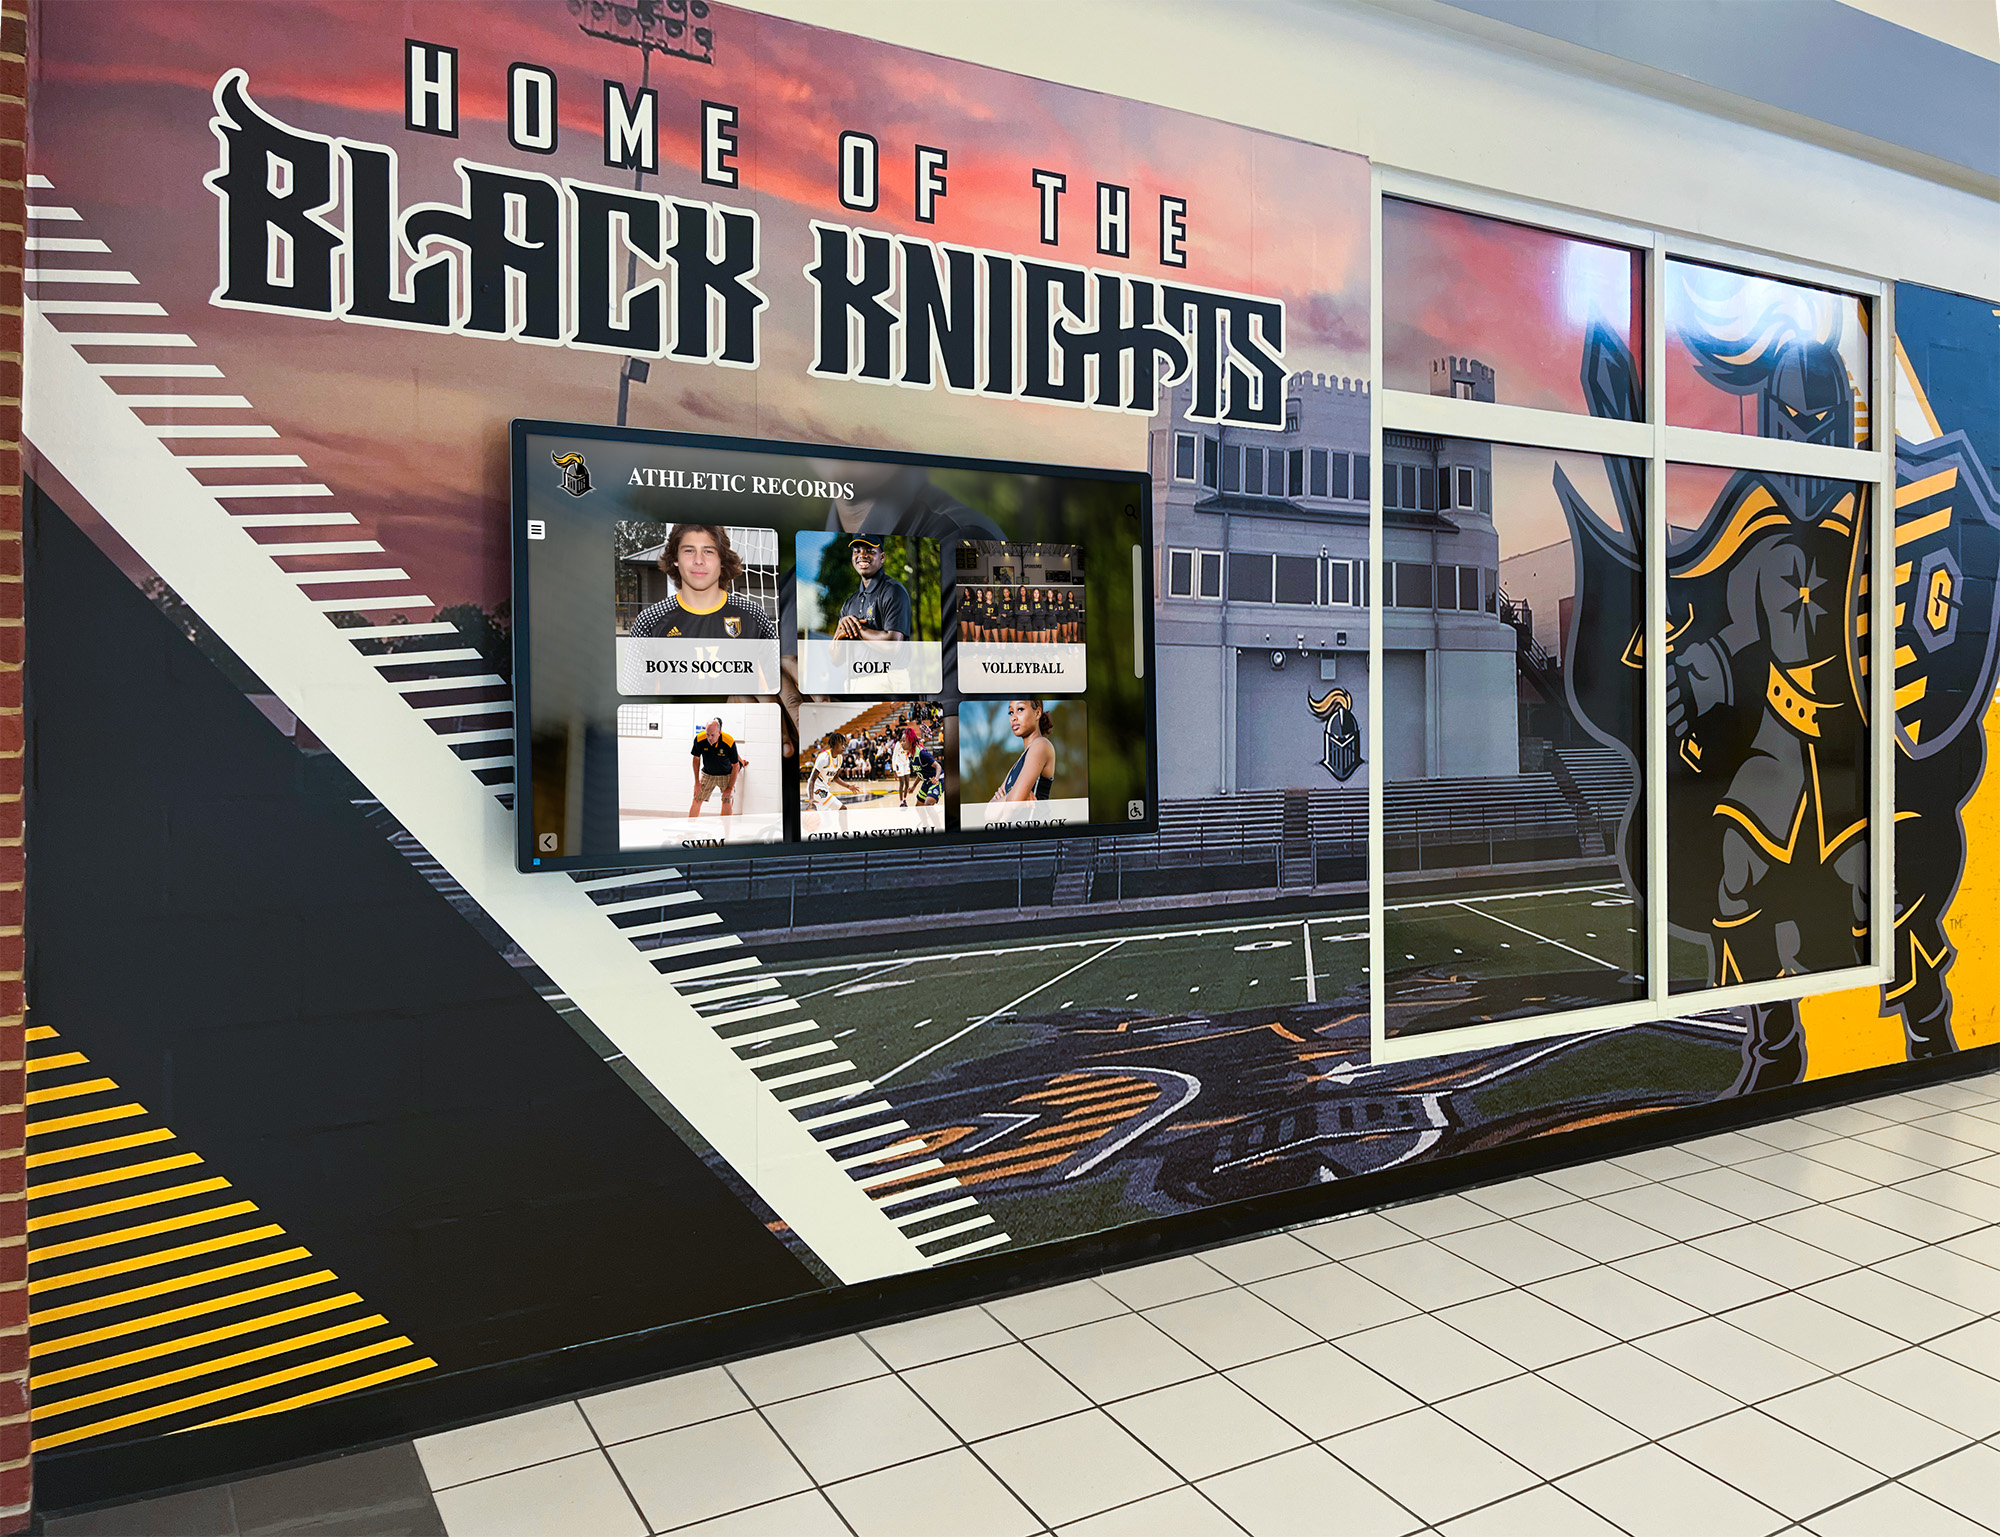
Storage forecasts tied to actual asset counts and measured file sizes produce far more reliable five-year projections than estimates based on general benchmarks alone
Addressing the Backlog: One-Time vs. Recurring Storage
Most programs conducting a capacity forecast for the first time discover two distinct storage problems: the recurring annual need for new content, and a one-time backlog of historical material that has never been formally archived.
Estimating the backlog:
- Identify the categories with unarchived historical material: print yearbooks to scan, old game tapes to transfer, film photographs to digitize, paper programs to capture.
- Estimate the volume in each category—for example, 40 yearbooks × 100 pages per yearbook × 15 MB per scanned page = 60 GB of raw scans, or 120 GB with one access copy paired to each archival TIFF.
- Apply the same size assumptions from the table above.
- Add the backlog total to your Year 1 provisioned storage as a clearly labeled separate line item.
Treating the backlog as a separate project prevents it from making the recurring forecast appear inflated. A one-time 2 TB digitization project added to a 400 GB/year recurring forecast should be understood and labeled separately—otherwise the Year 1 figure misleads budget reviewers who expect a consistent annual number.
For programs managing a significant historical backlog, the cataloging backlog reduction plan provides a prioritization method that can directly inform which backlog categories are digitized—and therefore added to the Year 1 estimate—versus which ones are deferred to later phases.
Video: The Largest Variable in Any Forecast
Video is the single largest driver of athletic archive storage growth and the hardest to estimate in advance, because decisions about what to record, at what resolution, and with what codec happen at the program level and change frequently.
Key video variables to document in your forecast assumptions:
| Variable | Smaller Program | Larger Program |
|---|---|---|
| Sports with video coverage | 3–5 | 10–20 |
| Average games recorded per sport per season | 5 | 15–20 |
| Average recording duration | 1.5 hours | 2–3 hours |
| Recording resolution | 1080p | 1080p to 4K |
| Storage per hour (1080p MP4, H.264) | 1.5–2 GB | — |
| Storage per hour (4K MP4, H.264) | 5–7 GB | — |
| Short highlight clips per game | 2–4 | 6–12 |
A program moving from 1080p to 4K for varsity sports should rerun its forecast before the transition begins, not after the first season of 4K footage arrives. The storage impact is immediate and significant.
Video archive best practices for hall of fame induction ceremonies and guidance on building a hall of fame video archive both address how ceremony footage—typically produced at higher quality than game recordings—introduces its own file-size variables worth tracking as a separate category in the forecast.
Photography: Managing Rapid Volume Growth
Athletic photography produces more files per event than any other asset type, and individual file sizes have grown substantially as camera megapixel counts have increased. Programs that upgrade cameras without updating their forecast assumptions will discover the discrepancy at the end of the season when storage usage exceeds projections.
Photo volume practices that stabilize forecast accuracy:
- Define a maximum edited deliverables per event guideline for contracted or staff photographers—500–800 selects per game is common and prevents unbounded volume growth while preserving documentary quality.
- Require edited deliverables in JPEG for the archive deposit, retaining RAW files only in a separate cold-storage tier if the program has a specific reason to keep them.
- Track file counts by sport across a full season so the following year’s estimate reflects real program activity rather than theoretical maximums.
For programs building their first systematic photo collection workflow, guidance on historical photo archives for schools and preserving historical photos in school athletic archives both offer practical collection frameworks that can be integrated directly into a capacity forecast’s photo-volume assumptions.
Storage Infrastructure Options
Once you have a five-year forecast, you can match projected volumes to infrastructure options that fit your budget and IT capacity.
| Infrastructure Type | Best Fit | Key Consideration |
|---|---|---|
| Cloud storage (general-purpose) | Ongoing operational archives up to several TB | Access speed and egress costs matter for large video files |
| Cloud storage (archive tier) | Historical masters rarely accessed | Lower per-GB cost; retrieval fees apply—not for active display use |
| Network-attached storage (NAS) | On-premises primary archive up to ~20 TB | Requires IT staff or vendor support for maintenance and drive replacement |
| Purpose-built DAM or archive platform | Programs needing search, tagging, and display integration | Often includes managed storage; verify included GB and overage pricing |
| Hybrid (cloud + NAS) | Larger programs with both active and archival content | Most flexible; highest management overhead |
For programs running digital hall-of-fame displays or lobby recognition systems, display-quality assets—typically JPEG for photos, compressed MP4 for video—can live on a display platform’s managed storage while archival masters remain in a separate cold or archive tier. Keeping display copies and archival masters on separate tiers reduces ongoing costs without sacrificing long-term preservation quality.
Understanding data integrity standards for digital hall of fame platforms helps teams determine which files require high-durability storage tiers versus those that can safely use lower-cost options.

Display platforms and archival storage can occupy separate tiers—planning both together in the same capacity forecast prevents mismatches between what a display needs and what the archive can supply
The Annual Capacity Review Checklist
A storage forecast built once becomes inaccurate within two to three years as equipment, collection policies, and program scope change. An annual review—typically 60–90 minutes—keeps the forecast current.
| Review Item | Notes |
|---|---|
| ☐ Pull actual storage consumed in the past 12 months | Compare to the forecasted figure; document the variance and its cause |
| ☐ Update file-size assumptions if equipment changed | New cameras, new codecs, or new scan settings alter per-file averages |
| ☐ Revise asset-count assumptions if collection scope changed | New sports covered, new event types, or new asset categories added |
| ☐ Recalculate five-year projections with updated inputs | Roll the table forward by one year and recompute remaining years |
| ☐ Check storage contract terms and current capacity allocation | Confirm current allocation against the revised Year 2 projection |
| ☐ Identify any backlog work planned for the coming year | Add one-time estimates to Year 2 as clearly labeled line items |
| ☐ Review redundancy status for all storage tiers | Verify 3-2-1 compliance; confirm the off-site copy is current |
| ☐ Update the retention schedule if policy changed | Removed retention categories reduce future storage need |
| ☐ Document all assumptions used this year | Record specific assumptions so next year’s reviewer can identify what changed |
| ☐ Share summary with IT director and budget owner | Capacity planning only affects infrastructure if it reaches decision-makers before budgets are set |
Scheduling this review at the same time each year—typically at the close of the school year or the start of the fiscal year when technology budgets are being assembled—ensures the forecast is current when storage contract renewals and equipment requests require it.
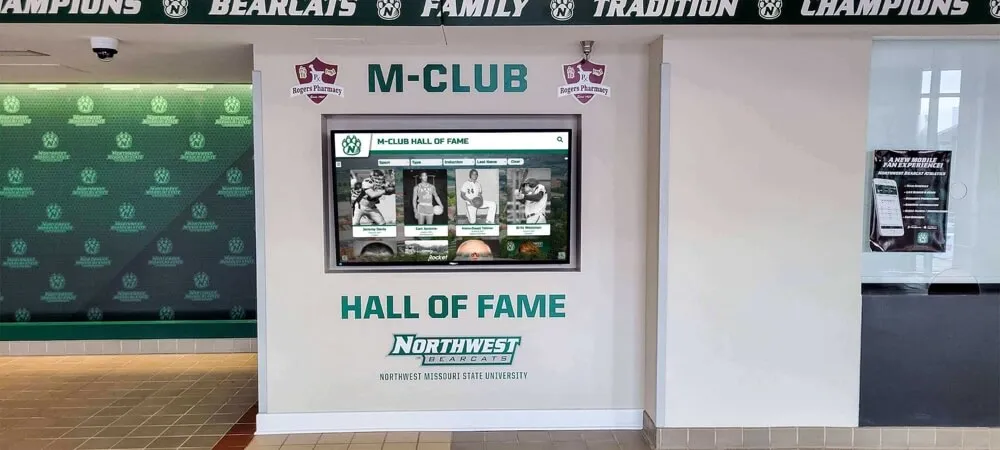
An annual capacity review keeps storage planning aligned with real program growth rather than assumptions that were accurate three years ago
Connecting Storage Planning to Recognition and Display Programs
A capacity forecast is most useful when connected to the programs that depend on archive content—not treated as a standalone IT exercise. The programs most directly affected by storage availability include:
Digital hall of fame and touchscreen displays. These systems draw on archived photos, video clips, and biographical documents to build athlete profiles, season galleries, and championship timelines. A display platform that cannot access high-resolution source files because archival storage is full or inaccessible cannot publish new content. Including display-quality file counts in the forecast as a tracked subset ensures display programs are never blocked by a storage constraint that could have been anticipated.
Sponsor and booster recognition programs. Sponsor banners, recognition walls, and booster honor boards require up-to-date graphics files and photographic assets. Programs that have formalized their archive storage typically find it easier to maintain and update recognition content because files are organized, accessible, and backed up to a known location.
Anniversary and reunion events. Historical asset requests spike around milestones and reunions. A program with a well-maintained archive backed by a current capacity forecast can fulfill these requests without scrambling. A program operating near storage limits may have removed or lost access to older materials that reunion planners need most.
Athletic publications and yearbook workflows. Yearbook advisors and communications staff pulling assets for annual publications need reliable access to high-resolution originals. A storage plan that provisions adequately for archival masters—not just web-sized copies—ensures publication workflows have the source files they need when deadlines arrive.
Frequently Asked Questions
How much storage does a typical high school athletic archive need?
Needs vary significantly by program size and collection scope. A small high school with 10–15 sports, moderate photo coverage, and limited video will typically generate 100–200 GB of raw archive content per year. With 3-copy redundancy, that requires provisioning 300–600 GB annually. A larger multi-sport program with full video coverage and active digitization may require 2–5 TB per year provisioned. The formula in this guide produces a number specific to your program; general estimates are useful only as a sanity check against the result.
Do we need to keep RAW photo files, or can we archive only JPEGs?
For most school athletic archives, archiving edited high-resolution JPEGs is sufficient and substantially reduces storage requirements. RAW files are useful during post-processing but carry no additional archival value once a high-quality JPEG deliverable has been produced. If your photographers shoot RAW+JPEG, specify JPEG as the archive deposit format in your collection policy and retain RAW only if you have a specific downstream reason, such as planned large-format print production.
Can we count on cloud storage costs going down, reducing the planning burden?
Per-gigabyte cloud storage costs have declined over time, but program storage needs have grown faster than costs have fallen. Do not rely on cost reductions to offset forecast growth. Plan for actual capacity requirements and treat cost reductions as a budget benefit rather than a substitute for capacity planning.
How should we handle storage for assets where rights ownership is uncertain?
Store uncertain assets in a restricted internal folder—separate from your public archive—and document the rights question in the asset’s metadata. Do not delete assets over rights uncertainty; deletion is irreversible, and rights questions are often resolvable with a straightforward outreach. If capacity is tight, flag rights-uncertain assets for a formal review cycle before removing them to free space.
What happens when storage limits are reached on a display platform?
Most display platforms stop accepting new uploads or send administrator alerts when limits approach. The practical risk is that time-sensitive content—photos from this week’s championship, for example—cannot be added until space is freed or a storage upgrade is purchased. Capacity planning prevents this by ensuring the storage upgrade decision is made in a budget cycle, not in an emergency after a limit is already hit.
Should coaches and athletic staff be part of the annual capacity review?
Yes. The most common sources of forecast error are changes in what coaches and sports information staff collect—new video coverage, new photography assignments, new statistics workflows. Including a brief check-in with sport-level staff during the annual review catches collection-scope changes before they produce a surprise in the year-end storage report.
How do we account for a large digitization project without distorting the recurring forecast?
Model the backlog as a one-time line item in Year 1 (or the year the project runs), clearly labeled separately from the recurring annual baseline. That way, budget reviewers see the actual ongoing cost of the archive and understand the digitization project as a one-time investment rather than a permanent increase in operating expenses.
See How a Managed Archive Platform Simplifies Storage Planning
Purpose-built athletic recognition platforms include managed storage with built-in capacity reporting, so your IT team and athletic staff always know where you stand—without manual audits or spreadsheet forecasts. See how the right platform can align archive storage, display content, and annual capacity planning in one place.
Request a DemoReady to see this for your school?
Picture your collection in a custom mockup
Start with your yearbook collection and digitization goals, then request a custom digital mockup for your school.